TEMpcPlot
Introduction
The determination of the crystallographic structure is the first step in the characterization of crystalline materials and the determination of the crystallographic lattice is the first important step for the determination of the ab initio structure. However, in the absence of suitable single crystals, this task from powder X-ray diffraction (XRD) patterns is often very difficult, especially when the sample is multiphase. In contrast, electron diffraction patterns of individual micro/nanocrystals can be easily obtained by using transmission electron microscopy (TEM), making this technique an indispensable tool, and complementary to XRD, for structural and microstructural characterization of new phases in solid state chemistry. Due to the very short electron wavelength (~0.02 Å), a zone axis electron diffraction pattern is an undistorted representation of a 2D cross-section of the 3D reciprocal lattice (RR3D). In an equivalent way to single crystal XRD, RR3D can be obtained by collecting a series of images of the same crystal by progressively tilting it in the microscope. In practice, it is not easy to reconstruct the RR3D and to determine manually the dimensions of the elementary meshes from a series of images. TEMpcPlot Python library, which uses as input one or more series of diffraction pictures acquired by rotating the crystal around a row of the RR3D and the angles of the goniometer.
The library TEMpcPlot has as object the treatments of a Sequence of electron diffraction cliches to obtain a three dimensional redcipriocal lattice. The idea behind is to find a way of work for TEM, available on pc, with a graphical approach (TEMpcPlot)
The library is divided in two main class
TEMpcPlot.SeqIm a sequence of image where each element of the class is an image perform
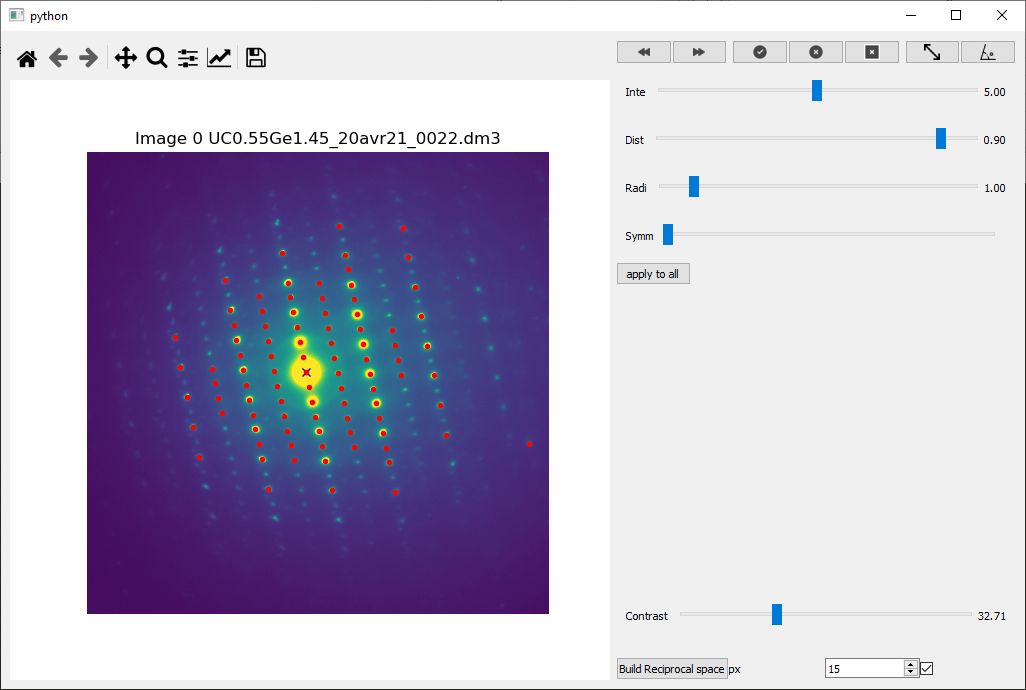
- the search for peaks
- the alignment of the images with respect to the origin and the rotation axis
- the calibration of the peaks in the common three-dimensional reciprocal space
- plot the calibrated images
EwaldPeaks Set of peaks position and intensity this class manages peaks position and intensity and the methods related to lattice indexing and refinement could be created as an attribute EwP of a SeqIm class by using methods D3_peaks or by sum with an another EwaldPeaks class with the same first image The Ewald Peaks EwP class which allows:
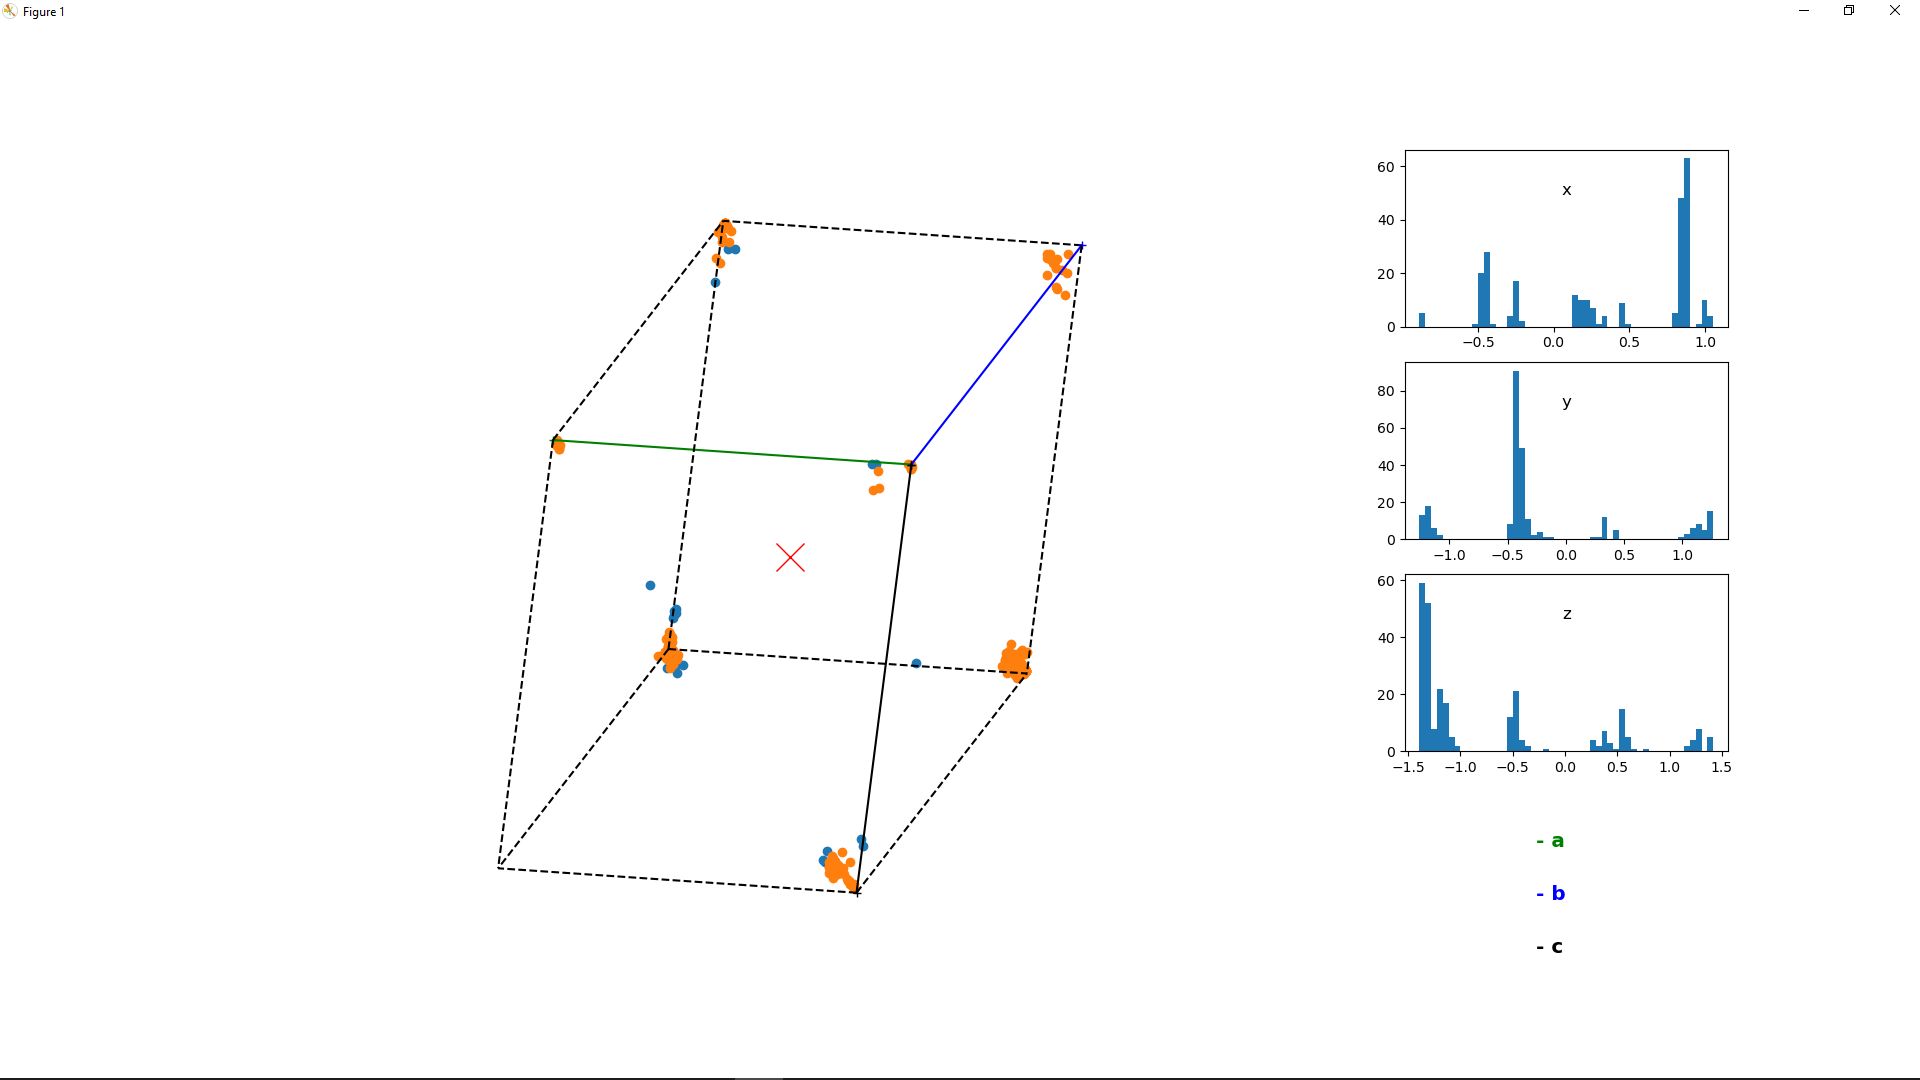
- a 3D graphical representation of the reciprocal space
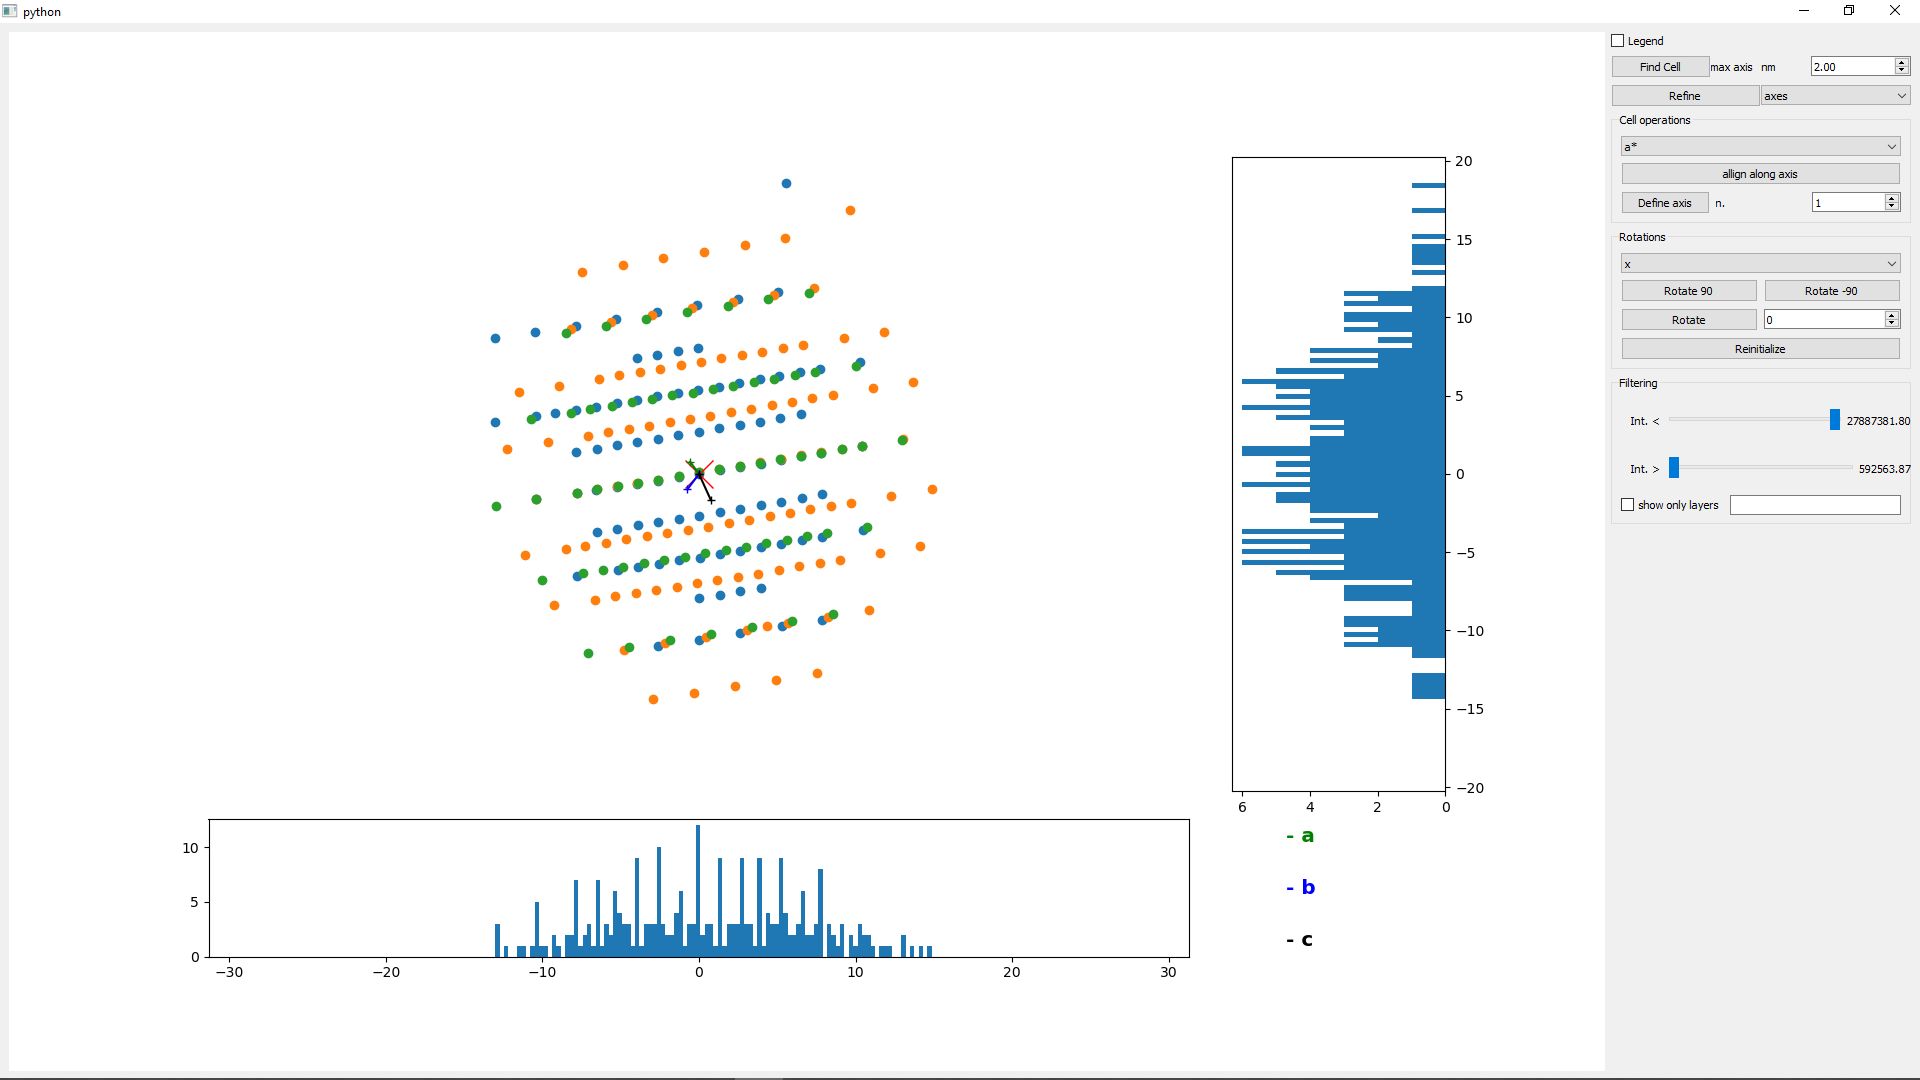
- the indexing of the peaks
- the refinement by the least squares method
- the reconstruction of the layers.
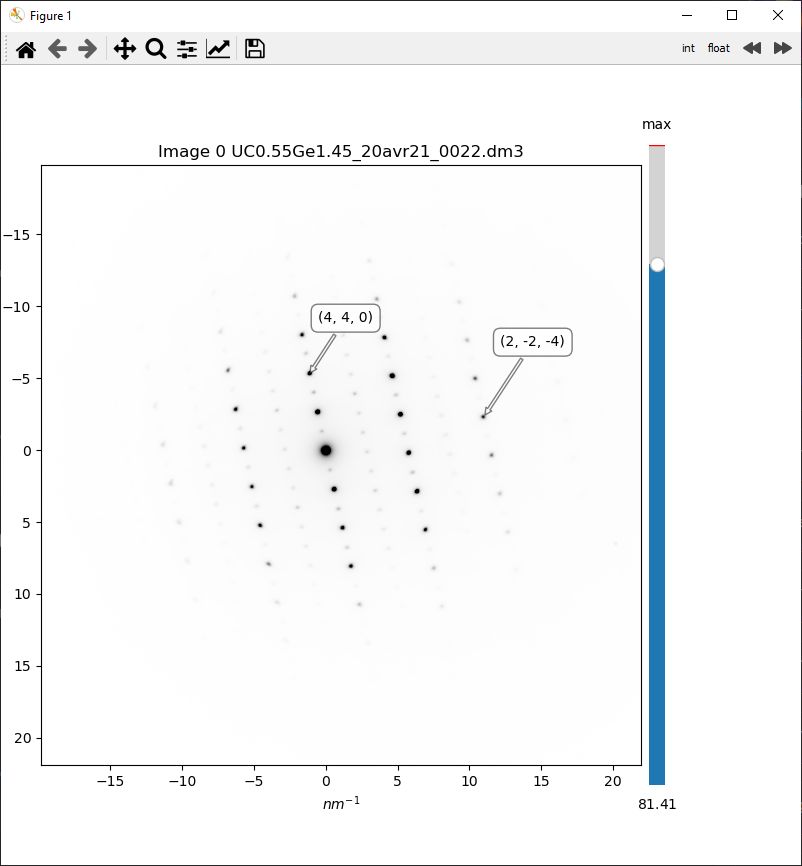
Screenshot
Peak Searching
Indexing procedure
Reduced Plot
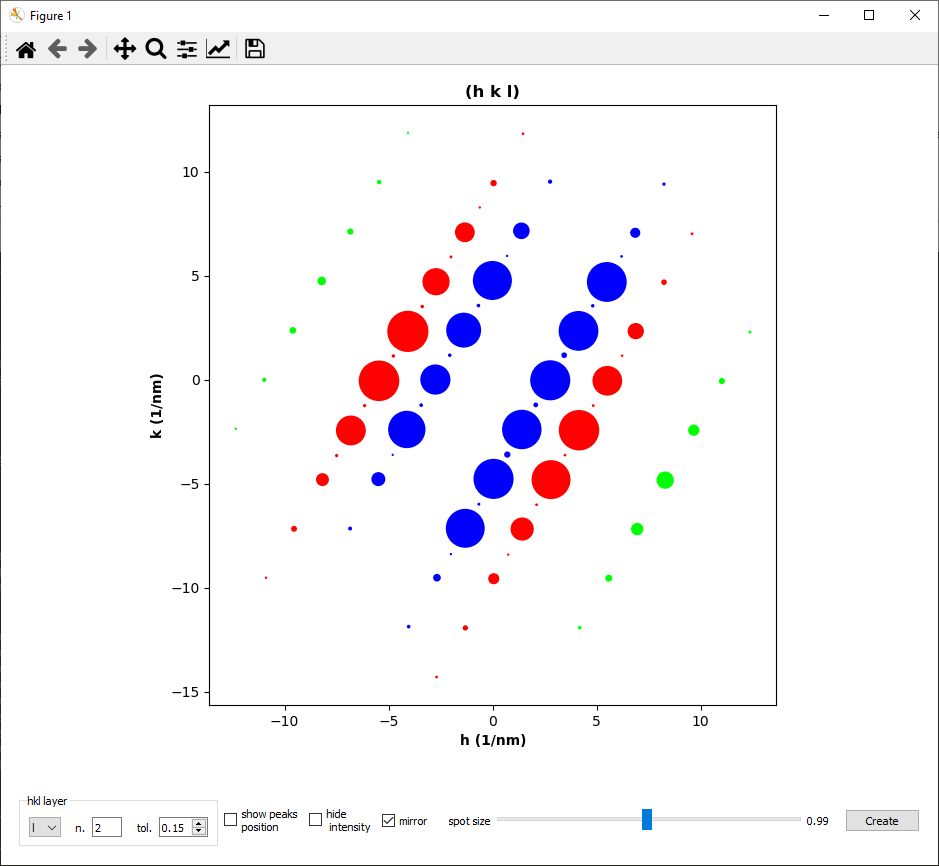
Plane Reconstruction
Indexed Images Plot
Step by step instructions for installation
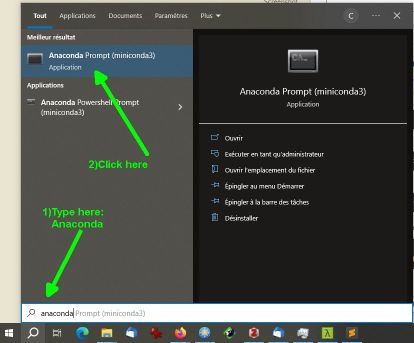
- install anaconda or miniconda direct download for windows here
-
open an anaconda prompt on the start menu
- type:
conda config --add channels conda-forge - type:
conda install ipython - type:
conda install -c cprestip tempcplot
if the conda install doesn’t work last resource is pip
conda install pip
pip install git+https://github.com/Prestipino/TEMpcPlot.git
UPDATE
The code is still in rapid change and could present several bug please update with the following command on an anaconda prompt
conda update -c cprestip --force-reinstall tempcplot
alternativelly for small update without complete compile version online, it is possible to dowload the package, and execute
python setup.py install
In order to work
-
create a text file *.sqi containing the name of files with the tilts angles in the working directory
Example \*.sqi: # comment UOs025Ge2_02juin21_0006.dm3 3.3 3.3 UOs025Ge2_02juin21_0007.dm3 6.7 1.6 UOs025Ge2_02juin21_0008.dm3 9.4 0.4 - open an anaconda prompth in the start menu
- type:
cd working_dir -
chande disk if necessary i.e. C: or D:
- type:
ipython - type:
import TEMpcPlot as TP - create the SeqIm object
Exp1 = TP.SeqIm(‘filename.sqi’)
If you are uysing ipython remenber that after a dot a tap press show all the available methods
Typical sequence of commands
The mode of use is relativelly simple : create a SeqIm object
Ex1 = TEMpcPlot.SeqIm(‘cr2.sqi’)
construct a seq Ex1.plot()
Ex1.D3_peaks(tollerance=15)
Ex1.EwP.plot() reconstruct reciprocal space and plot in a graph attribute more information on the wiki
Ex1.Ewp.create_layer(hkl)
Few set of data for tutorials
link to data
usefull command Documentation
the main class documentaion to look are
| ©2020, C. Prestipino. | Powered by Sphinx 3.0.4 & Alabaster 0.7.12 | Page source |
License
See the License File.